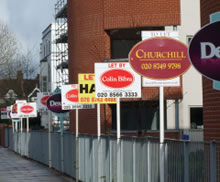
Shepherd's Bush Property Prices See Continued Boom
Average terrace costs over a million, average flat nearly half a million
Property prices in Shepherd's Bush have soared to new highs according to the latest official figures.
There were 170 sales in the W12 post code area reported to the Land Registry in the third quarter of 2014 at an average price of £680,051. This is up by 12.2% compared with the same quarter last year and means that local home values have nearly doubled over the last decade.
The main driver of the rise in recent months has been higher than normal activity in houses as opposed to flats. The latter made up 71% of sales in the area as opposed to 83% in the previous three months. There were 44 terraced properties sold during the quarter at an average price of £1,057,037, a new all-time high. Flats have also reached record prices with the average now not far short of half a million.
Estate agent Orchards of London, which has just opened a new branch in Shepherd's Bush, says the West London property market remains optimistic, despite impending factors including the General Election and a likely rate rise.
In its most recent Market Comment, the agent says: " An increasing population coupled with the fact that we are all living longer brings pressures on all aspects of our society and the housing market is no exception.
" Despite increases in house building in recent years we are still many tens of thousands of units a year short of that which is required to meet demand.
"This factor alone is likely to ensure that demand outstrips supply and ensure that prices hold up or increase into the future, albeit at a slower rate of increase than recently as a period of seeing wages catch up will be needed."
London property prices generally are up by 18.4% to £460,521 in the year to end September according to the Land Registry although they are slightly down from the level seen at the end of August. The a average house price in England and Wales is now £177,299 compared with the peak of £181,324 in November 2007. This is a rise of 7.2% compared with the same month last year.
The most up-to-date figures available show that during July 2014 the number of completed house sales in England & Wales increased by 7 per cent to 79,214 compared with 73,749 in July 2013. The number of properties sold in England and Wales for over £1 million in July 2014 increased by 19 per cent to 1,439 from 1,207 in July 2013.
The Royal Institution of Chartered Surveyors (RICS) are striking a cautious note pointing out that demand for property in London has been down for six months in a row. Prices are also falling in more recent months according to their survey which covers sales up to the end of October.
London is experiencing a fall in buyer demand with 62% more chartered surveyors reporting a fall over the last month. Significantly, a little more stock is now coming onto the market with 15% more chartered surveyors seeing a rise in new instructions up from 3% more last month. The RICS say that this points to the market in London moving towards a more sustainable position and they remain modestly positive on a twelve month view.
In London, tenant demand was broadly flat over the last quarter. Despite this, rents are still expected to continue to move higher albeit by a little less than 2 per cent over the next twelve months.
Simon Rubinsohn, RICS Chief Economist, said, 'The flatter trend in the market is partly a reflection of potential buyers becoming a little more cautious about making a purchase as more stringent lending criteria has made it harder to access mortgage finance. An increasing awareness of the approaching general election also appears to be contributing to the softer market if the responses to the latest survey are anything to go by. However, with new instructions still flat at a headline level as has been the case for most of the last year it seems implausible that the dip in demand will result in very much of a decline in house prices.'
The numbers below are subject to revision as is it usual that some properties are added late to the Land Registry's database.
| Shepherd's Bush Property Prices (April - June 2014) | ||||||||
|---|---|---|---|---|---|---|---|---|
| Area | Semi-detached | Sales | Terraced | Sales | Flat/ maisonette |
Sales | Overall Averages | Overall Sales |
| W12 0 | 499999 | 1 | 730445 | 18 | 472082 | 10 | 633407 | 29 |
| W12 7 | - | - | 805714 | 7 | 419729 | 44 | 472707 | 51 |
| W12 8 | - | - | 1478586 | 7 | 553069 | 28 | 738172 | 35 |
| W12 9 | 2757375 | 4 | 1447626 | 12 | 484482 | 39 | 859924 | 55 |
| Total | 2305900 | 5 | 1057037 | 44 | 475782 | 121 | 680051 | 170 |
| Change over quarter | 100.5% | 400.0% | 16.9% | 91.3% | 17.6% | 0.0% | 39.1% | 17.2% |
| Change over year | 97.9% | -28.6% | 4.4% | -21.4% | 25.5% | 2.5% | 12.2% | -6.6% |
| Change over three years | 167.9% | -54.5% | 78.3% | 2.3% | 47.9% | 65.8% | 47.8% | 33.9% |
| Change over five years | 220.6% | -28.6% | 94.6% | 22.2% | 60.1% | 128.3% | 61.9% | 77.1% |
| Change over ten years | - | 98.9% | - | |||||
Source: Land Registry
November 24, 2014
