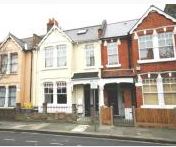
Average Price of Terraced House in W12 Creeps Towards One Million
But high proportion of flats sold in spring drags down overall average
The average price of a terraced house in Shepherd's Bush jumped by almost 14.3% between April and June to break through the £900,000 barrier.
This took the average from £791,564 to £904,500. What's more, the rise was consistent throughout the Bush, with prices up all four postcode areas. In W12 0 in the north, the average rose from £613,683 in the first quarter of the year to £797,100 while in W12 8 and W12 9 it climbed above one million.
It wasn't all good news for local agents, as the volume of terraced houses changing hands during the period dropped considerably from 41 to just 23, as well as just one semi-detached house.
Just the opposite was true of flats and maisonettes however, with sales rising from 82 in the first three months of the year to 121 in the second.
Prices of flats remained stable, with the average showing only a small drop of 1.1% on the previous quarter, down from £409,013 to £404,430.
This high proportion of flat sales - 121 out of 145 or 83% of overall sales, created a misleading statistical anomaly, dragging down the average overall price from £555,002 in the previous quarter to £488,894.
The healthy demand for smaller properties in the local area is down to a number of factors, says Paul Price of Marsh and Parsons Brook Green office. " The flat market is dominated by high-earning young professionals, who are often relying on parental help," he says." These purchasers have little hope of raising the required deposit, so are seeking the support from their parents who are happy to invest their money into a bullet proof, tax efficient investment.
"Unlike our more central offices, where the majority of buyers are end-users, there is still a good amount of buy-to-let investors in this part of London. We have also seen the return of developers in the last 12 months, who are sitting tight for the right opportunities. This is always a sure sign that confidence has well and truly returned to the market."
The average price in London during the month of June was £437,608 which is up by 16.4% compared with the same month in 2013. For England and Wales as a whole the average is now £172,011 compared with the peak of £181,466 in November 2007 up by 6.4%.
The most up-to-date figures available show that during April 2014 the number of completed house sales in England & Wales increased by 31 per cent to 66,659 compared with 51,022 in April 2013.
The number of properties sold in England and Wales for over £1 million in April 2014 increased by 39 per cent to 1,028 from 740 in April 2013.
The numbers below are subject to revision as is it usual that some properties are added late to the Land Registry's database.
| Shepherd's Bush Property Prices (April - June 2014) | ||||||||
|---|---|---|---|---|---|---|---|---|
| Area | Semi-detached | Sales | Terraced | Sales | Flat/ maisonette |
Sales | Overall Averages | Overall Sales |
| W12 0 | 0 | 0 | 797100 | 15 | 418273 | 11 | 636827 | 26 |
| W12 7 | 0 | 0 | 733000 | 2 | 395972 | 38 | 412824 | 40 |
| W12 8 | 0 | 0 | 1375000 | 1 | 386445 | 53 | 404752 | 54 |
| W12 9 | 1150101 | 1 | 1201200 | 5 | 463500 | 19 | 638504 | 25 |
| Total | 1150101 | 1 | 904500 | 23 | 404430 | 121 | 488894 | 145 |
| Change over quarter | -12.4% | -66.7% | 14.3% | -43.9% | -1.1% | 47.6% | -11.9% | 15.1% |
| Change over year | 18.4% | -85.7% | 6.7% | -30.3% | 11.3% | 30.1% | -5.2% | 9.0% |
| Change over three years | 17.6% | -83.3% | 18.7% | -17.9% | 36.1% | 142.0% | -2.3% | 72.6% |
| Change over five years | 302.3% | -75.0% | 94.8% | 91.7% | 64.6% | 365.4% | 56.7% | 245.2% |
| Change over ten years | - | - | - | - | - | - | 62.6% | - |
| Shepherd's Bush Property Prices (January - March 2014) | ||||||||
|---|---|---|---|---|---|---|---|---|
| Area | Semi-detached | Sales | Terraced | Sales | Flat/ maisonette |
Sales | Overall Averages | Overall Sales |
| W12 0 | 0 | 0 | 613683 | 14 | 343096 | 9 | 507801 | 23 |
| W12 7 | 0 | 0 | 723786 | 7 | 309439 | 16 | 435545 | 23 |
| W12 8 | 0 | 0 | 736250 | 4 | 423450 | 28 | 462550 | 32 |
| W12 9 | 1312333 | 3 | 990691 | 16 | 470469 | 29 | 696493 | 48 |
| Total | 1312333 | 3 | 791564 | 41 | 409013 | 82 | 555002 | 126 |
| Change over quarter | 58.7% | -66.7% | -8.7% | 41.4% | 6.9% | -12.8% | 5.2% | -5.3% |
| Change over year | - | - | 5.3% | -10.9% | 16.3% | 5.1% | 11.0% | 1.6% |
| Change over three years | 23.6% | 0.0% | 29.3% | 36.7% | 30.7% | 18.8% | 31.2% | 23.5% |
| Change over five years | 140.0% | -57.1% | 116.9% | 485.7% | 45.9% | 272.7% | 59.2% | 250.0% |
| Change over ten years | - | - | - | - | - | - | 92.3% | - |
Source: Land Registry
September 1, 2014
Related links
|
