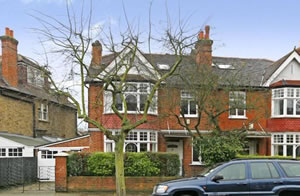
W12 Property Prices Hit Record Highs
Average terraced house now worth over one million pounds
The average property price in Shepherd's Bush leapt to over £600,000 in the third quarter of 2013.
This is up by 17.6% over the previous quarter when the average was £515,618.
This means the average value of a home in W12 has more than doubled in the last ten years.
Prices were up on all types of property, though flats showed the most modest rise of 4.3%, from £363,415 to £378,981.
The average price of terraced houses however, jumped above the million mark to reach £1,012,432 - up 19.4% on the second quarter's average of £847,665.
It was a similar picture for semi-detached homes reaching an average £1,165,000 - up 19.9% on the previous quarter's £971,429.
The highest sale price recorded during the period was £2,250,000 for a home in Hartswood Road. This made it the eigth highest price ever paid in the W12 post code area.
There was also a strong growth in sales up by over a third compared to same period last year, and the highest level of turnover seen for six years.
Emma Craigie-Hallett, manager of estate agent Faron Sutaria in Shepherd's Bush says that many properties in the area are being sold within days at above the asking price.
"We are seeing more applicants looking in Shepherds Bush who originally began their search in Fulham," she says," realising that W12 and W14 offer exceptional transport links whilst the regeneration program also makes it an ideal area to invest in."
The September data from Land Registry's House Price Index shows that London remains the best performing property market in England and Wales. The average price of a home in the capital rose by 9.3% over the year to £393,462.
Jon Pishiri, RICS London residential spokesperson says: " Increasing demand and continuing low supply are major determinants in London prices being pushed up. The Help to Buy initiative coupled with rising rental values are further encouraging people to purchase a house as opposed to renting. There is an obvious need to increase supply to the market in order to address this problem."
For the country as a whole prices rose by 3.4% which takes the average property value in England and Wales to £167,063. Repossession volumes decreased by 28 per cent in July 2013 to 1,187 compared with 1,645 in July 2012.
The number of properties sold in England and Wales for over £1 million in July 2013 increased by 34 per cent to 1,143 from 852 in July 2012.
The numbers below are subject to revision as is it usual that some properties are added late to the Land Registry's database.
| Shepherd's Bush Property Prices (July - September 2013) | ||||||||||
|---|---|---|---|---|---|---|---|---|---|---|
| Area | Detached | Sales | Semi- detached |
Sales | Terraced | Sales | Flat/ mais |
Sales | Overall Ave |
Overall Sales |
| W12 0 | 0 | 0 | 720000 | 3 | 671500 | 16 | 382553 | 18 | 534864 | 37 |
| W12 7 | 0 | 0 | 0 | 0 | 1024286 | 7 | 271820 | 11 | 564446 | 18 |
| W12 8 | 0 | 0 | 0 | 0 | 1253077 | 13 | 384092 | 42 | 589488 | 55 |
| W12 9 | 735000 | 1 | 1498750 | 4 | 1124609 | 20 | 401911 | 46 | 671973 | 71 |
| Total | 735000 | 1 | 1165000 | 7 | 1012432 | 56 | 378981 | 118 | 606076 | 182 |
| Change over quarter | 19.9% | 0.0% | 19.4% | 69.7% | 4.3% | 26.9% | 17.6% | 36.8% | ||
| Change over year | -18.2% | 75.0% | 43.7% | 0.0% | 15.5% | 66.2% | 16.0% | 38.9% | ||
| Change over three years | -0.7% | 40.0% | 62.2% | 27.3% | 20.3% | 122.6% | 23.6% | 78.4% | ||
| Change over five years | 48.6% | - | ||||||||
| Change over ten years | 104.4% | - | ||||||||
| Shepherd's Bush Property Prices (April - June 2013) | ||||||||
|---|---|---|---|---|---|---|---|---|
| Area | Semi-Det | Sales | Terraced | Sales | Flat/Mais | Sales | Total Ave | Total Sales |
| W12 0 | 477,500 | 2 | 538,125 | 8 | 391,001 | 10 | 458,501 | 20 |
| W12 7 | - |
- |
312,000 | 3 | 347,922 | 17 | 342,534 | 20 |
| W12 8 | 1,197,500 | 2 | 1,264,268 | 11 | 357,953 | 37 | 590,925 | 50 |
| W12 9 | 1,150,000 | 3 | 802,273 | 11 | 369,952 | 29 | 534,967 | 43 |
| Total | 971,429 | 7 | 847,665 | 33 | 363,415 | 93 | 515,568 | 133 |
| Change over quarter | - |
- |
12.8% | -28.3% | 3.4% | 19.2% | 3.1% | 7.3% |
| Change over year | 92.2% | 40.0% | 30.8% | -2.9% | 14.6% | 14.8% | 23.1% | 10.8% |
| Change over three years | -19.5% | 16.7% | 42.6% | 13.8% | 12.2% | 55.0% | 11.5% | 40.0% |
| Change over five years | 30.2% | - | ||||||
| Change over ten years | 86.9% | - | ||||||
Source: Land Registry
November 22, 2013
Related links
|
