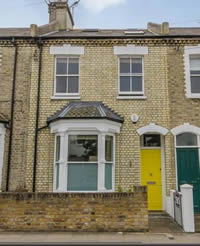
Average Price of Flats and Terraced Houses in W12 Hit Record Highs
As local property market bounces back in spring
The average price of both flats and terraced houses in Shepherd's Bush reached all time highs in the second quarter of 2013.
Terraced houses were the strongest performers, with the average jumping up almost £100,000, from £751,399 to £847,665. This represented a rise of 12.8% over the previous quarter and 30.8% over the last year.
Flats and maisonettes were also up, though by a more modest 3.4% from £351,607 to £363,415.
There was more good news for local agents at the top end of the market. While no semi-detached houses changed hands between January and March this year, seven were sold between April and June, with the average just under the million mark at £971,429.
However, most of the activity was at the other end of the market, with the number of flat sales climbing from 78 to 93. This higher proportion of lower priced properties had the effect of driving down the overall average, which was £515,568, £7,000 less than the all time high of £522,535 reached between July and September last year.
Emma Craigie- Halkett, manager of Faron Sutaria in Shepherd's Bush says she expects the number of people looking for flats to remain high, with many selling within days and demand exceeding supply.
She adds: " We are seeing more applicants looking in Shepherds Bush who originally began their search in Fulham, realising that W12 and W14 offer exceptional transport links whilst the regeneration program also makes it an ideal area to invest in."
The June data from Land Registry's House Price Index shows that London saw a sharp rise in prices during the month up by 3.1% compared with May. It remains the best performing property market in England and Wales rising by 6.9% over the last year to £383,930.
For the country as a whole prices only rose by 0.8% over the year which takes the average property value in England and Wales to £162,621.
The most up-to-date figures available show that during April 2013, the number of completed house sales in England and Wales increased by 12 per cent to 48,367 compared with 43,252 in April 2012.
The number of properties sold in England and Wales for over £1 million in April 2013 increased by 45 per cent to 703 from 484 in April 2012.
The West Midlands was the only region to see an increase (8 per cent) in repossession sales between April 2012 and April 2013. The region with the greatest fall in the number of repossession sales was London where repossessions dropped by 37 per cent (April 2013 compared with April 2012).
The numbers below are subject to revision as is it usual that some properties are added late to the Land Registry's database.
| Shepherd's Bush Property Prices (April - June 2013) | ||||||||
|---|---|---|---|---|---|---|---|---|
| Area | Semi-Det | Sales | Terraced | Sales | Flat/Mais | Sales | Total Ave | Total Sales |
| W12 0 | 477,500 | 2 | 538,125 | 8 | 391,001 | 10 | 458,501 | 20 |
| W12 7 | - |
- |
312,000 | 3 | 347,922 | 17 | 342,534 | 20 |
| W12 8 | 1,197,500 | 2 | 1,264,268 | 11 | 357,953 | 37 | 590,925 | 50 |
| W12 9 | 1,150,000 | 3 | 802,273 | 11 | 369,952 | 29 | 534,967 | 43 |
| Total | 971,429 | 7 | 847,665 | 33 | 363,415 | 93 | 515,568 | 133 |
| Change over quarter | - |
- |
12.8% | -28.3% | 3.4% | 19.2% | 3.1% | 7.3% |
| Change over year | 92.2% | 40.0% | 30.8% | -2.9% | 14.6% | 14.8% | 23.1% | 10.8% |
| Change over three years | -19.5% | 16.7% | 42.6% | 13.8% | 12.2% | 55.0% | 11.5% | 40.0% |
| Change over five years | 30.2% | - | ||||||
| Change over ten years | 86.9% | - | ||||||
| Shepherd's Bush Property Prices (January - March 2013) | ||||||
|---|---|---|---|---|---|---|
| Area | Terraced | Sales | Flat/Mais | Sales | Total Averages | Total Sales |
| W12 0 | 566186 | 18 | 291890 | 10 | 468223 | 28 |
| W12 7 | 458583 | 6 | 284563 | 15 | 334283 | 21 |
| W12 8 | 1047166 | 12 | 387998 | 28 | 585748 | 40 |
| W12 9 | 905550 | 10 | 374961 | 25 | 526558 | 35 |
| Total | 751399 | 46 | 351607 | 78 | 499917 | 124 |
| Change over quarter | -9.8% | 70.4% | 1.8% | 23.8% | 0.8% | 33.3% |
| Change over year | 11.4% | 64.3% | 5.4% | 59.2% | 9.3% | 61.0% |
| Change over three years | 29.3% | 119.0% | 16.9% | 36.8% | 24.0% | 53.1% |
| Change over five years | 23.4% | 91.7% | 19.3% | 9.9% | 22.2% | 25.3% |
| Change over ten years | 81.2% | - | ||||
Source: Land Registry
September 5, 2013
Related links
|
