Hammersmith Property Prices Spring to All Time High
With the value of flats in W6 up by a quarter
Hammersmith property prices hit a new record high in the second quarter of 2014, with the overall average rising by 9.4% from £727,546 in the previous quarter to £795,939.
During this spring quarter, flats were the big success story, with a huge boost in both the average price, which shot up by almost a quarter - 24.9% to be exact - from £446,869 to £558,070, and the number sold, up from 77 in the first three months of the year to 99 in the second.
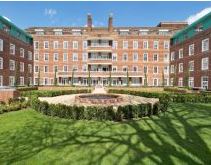
With the bulk of the sales - 58 - taking place in the W6 0 area, it appears the main reason behind this surge is the popularity of Linden Homes' Ashlar Court development close to Ravenscourt Park, where only a few flats remain for sale out of a total of 68.
Houses however, fared less well in between April and June. Detached and semi-detached houses both showed big drops in the average price, but with only three of each changing hands, this may not represent a long term trend.
Terraced houses by contrast slipped by only a 1.1% from £1,311,983 to £1,297,587, with the average price in all four postcode areas in W6 now above one million.
The good news for local estate agents was the rise in the number of terraced houses changing hands - up from 27 between the cold, dark months of January to March to 38.
The average price in London during the month of June was £437,608 which is up by 16.4% compared with the same month in 2013. For England and Wales as a whole the average is now £172,011 compared with the peak of £181,466 in November 2007 up by 6.4%.
The most up-to-date figures available show that during April 2014 the number of completed house sales in England & Wales increased by 31 per cent to 66,659 compared with 51,022 in April 2013.
The number of properties sold in England and Wales for over £1 million in April 2014 increased by 39 per cent to 1,028 from 740 in April 2013.
A detailed listing of properties sold recently in the area will be appearing in a forthcoming edition of the Hammersmith newsletter.
Hammersmith Property Prices (April - June 2014) |
||||||||||
|---|---|---|---|---|---|---|---|---|---|---|
Area |
Detached |
Sales |
Semi- |
Sales |
Terraced |
Sales |
Flat/ |
Sales |
Overall Ave |
Overall Sales |
| W6 0 | 1720000 | 1 | 1916000 | 2 | 1233665 | 14 | 574873 | 58 | 748879 | 75 |
| W6 7 | 0 | 0 | 0 | 0 | 1511500 | 6 | 656593 | 13 | 926563 | 19 |
| W6 8 | 1100000 | 1 | 1410000 | 1 | 1152222 | 9 | 496479 | 17 | 761433 | 28 |
| W6 9 | 1200000 | 1 | 0 | 0 | 1399778 | 9 | 448223 | 11 | 891831 | 21 |
| Total | 1340000 | 3 | 1747333 | 3 | 1297587 | 38 | 558070 | 99 | 795939 | 143 |
| Last quarter | -31.3% | 200.0% | -42.4% | 50.0% | -1.1% | 40.7% | 24.9% | 28.6% | 9.4% | 33.6% |
| Last year | 72.9% | 200.0% | -14.1% | -40.0% | 17.5% | 8.6% | 37.1% | 26.9% | 16.4% | 20.2% |
| Last three years | -0.9% | -25.0% | 44.9% | -5.0% | 57.8% | 76.8% | 27.0% | 43.0% | ||
| Last five years | 147.8% | 0.0% | 128.5% | 72.7% | 81.0% | 230.0% | 83.5% | 160.0% | ||
| Last ten years | 165.4% | -47.9% | 111.2% | -11.6% | 125.5% | -22.7% | ||||
Source: Land Registry
August 22, 2014
Related links
|

