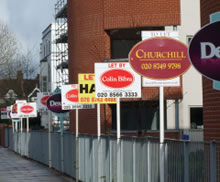
Shepherd's Bush House Prices Fall
Average sale price down from previous peak
After reaching record levels in earlier months the average sale price of a property in W12 has fallen according to the latest official figures from the Land Registry.
The fourth quarter of 2010 saw the average price for the area fall to £426,400, down by 13% - almost £65,000 - from the previous quarter. This was mainly due to a reduction in the number of sales of larger semi-detached properties and terraced houses.
The fall during the quarter brings prices down from the record levels seen earlier in the year, when the average price soared to £490,388, to more or less the same level they were 12 months ago.
Flat prices were steady over the quarter and have managed to rise by 6.4% compared with a year ago.
Of particular concern to agents will be the fall in the number of transactions. Although levels haven't quite sunk to the numbers seen in 2009 the number of sales is down by 17.1% compared to the previous year.
London as a whole remains by far and away the strongest area in the country in price terms with home values rising by 6.2% in December compared to the same month in 2009. The average London property now costs £342,325.
For England and Wales as a whole property prices rose by 1.5% with many areas of the north seeing falling values over the year. The average home price in the U.K. is now £163,814.
Shepherd's Bush Property Prices - October - December 2010
| Area | Semi-Det | Sales | Terraced | Sales | Flat/Mais | Sales | Total Averages | Total Sales |
|---|---|---|---|---|---|---|---|---|
| W12 0 | 0 | 0 | 427863 | 11 | 236250 | 6 | 360235 | 17 |
| W12 7 | 0 | 0 | 511166 | 3 | 272000 | 11 | 323250 | 14 |
| W12 8 | 0 | 0 | 642390 | 5 | 354059 | 16 | 422709 | 21 |
| W12 9 | 890833 | 3 | 641428 | 14 | 328775 | 18 | 502013 | 35 |
| Total | 890833 | 3 | 558543 | 33 | 313576 | 51 | 426400 | 87 |
| Change over quarter | -24.0% | -40.0% | -10.5% | -25.0% | -0.4% | -3.8% | -13.0% | -14.7% |
| Change over year | -38.0% | -40.0% | 2.3% | 0.0% | 6.4% | -23.9% | -0.4% | -17.1% |
Shepherd's Bush Property Prices - July - September 2010
| Area | Semi-Det | Sales | Terraced | Sales | Flat/Mais | Sales | Total Averages | Total Sales |
|---|---|---|---|---|---|---|---|---|
| W12 0 | 0 | 0 | 424123 | 15 | 306666 | 3 | 404547 | 18 |
| W12 7 | 0 | 0 | 677714 | 7 | 264809 | 11 | 425383 | 18 |
| W12 8 | 0 | 0 | 790000 | 5 | 356194 | 19 | 446570 | 24 |
| W12 9 | 1172800 | 5 | 729780 | 17 | 304645 | 20 | 580075 | 42 |
| Total | 1172800 | 5 | 624139 | 44 | 314971 | 53 | 490388 | 102 |
| Change over quarter | -2.8% | -16.7% | 5.0% | 51.7% | -2.8% | -11.7% | 6.1% | 7.4% |
| Change over year | 63.1% | -28.6% | 14.9% | 22.2% | 6.0% | 0.0% | 16.7% | 6.3% |
Source: Land Registry
March 18, 2011
