Local Road Retains Title of Nation's Most Congested
Peak delays on A406 from Chiswick Roundabout to Hanger Lane worst in UK

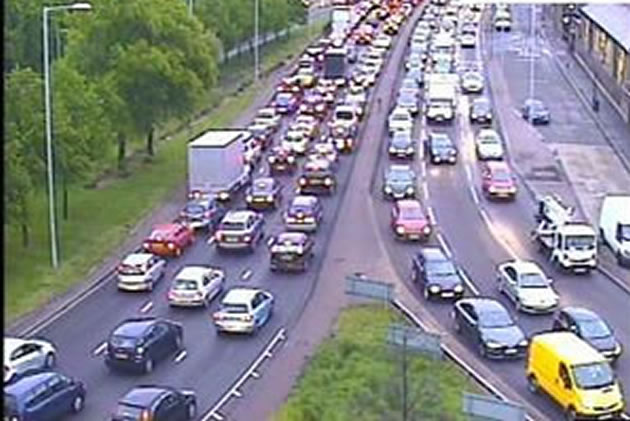
A new report has once again concluded that the North Circular Road (A406) between Chiswick Roundabout and Hanger Lane in Ealing is the nation’s most congested road. This is the second year in a row that the road has been ranked top in the UK for traffic delays.
The INRIX 2017 Global Traffic Scorecard states that if you were using the road every day during morning and evening peaks you would spend 56 hours stuck in traffic over a year.
It is likely that most of the delays caused on this road occur further north past the Uxbridge Road when it narrows to a single lane but during 2017 there will have been additional delays due to lane restrictions caused by the Power Road Bridge project. These are expected to continue into the autumn having originally been scheduled to finish at the end of 2017.
The report analyses and ranks the impact of traffic congestion in over one thousand cities across 38 countries which its authors say makes it the largest ever study of its kind. The data was collected from 300 million connected cars and devices.
London is ranked as the UK’s most congested city for the tenth year running with motorist spending around 74 hours a year stuck in traffic during peak times, about 13% of their driving time. The total cost to the city is estimated as £9.5billion and the cost per driver is £2,430 per annum. Of cities in Europe, only Moscow has more congestion. Drivers in London spent an average of 74 hours in gridlock during peak hours, an increase of one hour since last year.
Top Worst Corridors: 2017 |
|||||||
|---|---|---|---|---|---|---|---|
Rank |
Road |
From |
To |
Worst Peak Period |
AM Peak Average Speed (mph) |
PM Peak Average Speed (mph) |
Total Hours of Delay (p.p.p.a) |
1 |
A406 |
A205 Chiswick Roundabout |
A40 Hangar Lane |
PM |
16.54 |
9.27 |
56 |
2 |
A23 |
Kennington Park |
Norbury Station |
PM |
15.20 |
11.56 |
50 |
3 |
A4200/A4 |
Russell Square |
New Fetter Lane |
AM |
6.64 |
7.24 |
47 |
4 |
Earls Court Road |
Kensington High St |
A308 |
AM |
9.01 |
10.23 |
42 |
5 |
A406 |
Finchley Road |
Colney Hatch Lane |
PM |
23.40 |
15.53 |
42 |
Source: INRIX
Speeds fall by 81% (20 mph to 3.9 mph) in the centre of London during daytime hours when congestion was at its worst, and by 83% (22 mph to 3.7 mph) in the evening during the worst periods.
The UK has the third highest level of congestion in Europe beaten only by Russia and Turkey with the report stating that the direct and indirect costs of this totals more than £37 billion or over one thousand pounds per driver.
Los Angeles is ranked as the city most affected by congestion with drivers spending on average 102 peak hours in congestion in 2017.
| INRIX 2017 Traffic Scorecard - UK's 10 Most Congested Cities / Large Urban Areas | |||
|---|---|---|---|
| City | Peak Hours Spent | Total Cost Per Driver | Total Cost to the City |
| London | 74 |
£2,430 |
£9.5bn |
| Manchester | 39 |
£1,403 |
£345m |
| Birmingham | 36 |
£1,281 |
£632m |
| Luton | 29 |
£1,143 |
£102m |
| Edinburgh | 28 |
£1,155 |
£309m |
| Bournemouth | 27 |
£1,225 |
£121m |
| Bristol | 27 |
£1,028 |
£225m |
| Newcastle | 24 |
£991 |
£139m |
| Coventry | 23 |
£905 |
£140m |
| Liverpool | 20 |
£1,101 |
£273m |
Dr. Graham Cookson, Chief Economist, INRIX said, "Combined with the rising price of motoring, the cost of congestion is astonishing - it takes billions out of the economy and impacts businesses and individuals alike. "With the Office of National Statistics showing more cars on the road than ever before, we need to consider innovative new approaches to solving the issue. Increased flexible working or road charges have potential, however, transport authorities should be looking to exciting developments in data analytics and AI which promise to reinvent our approach to traffic management."
February 6, 2018