A406 Between Chiswick Roundabout and Hanger Lane 'Nation's Most Congested'
Study shows average driver was delayed by 73 hours on North Circular during 2016
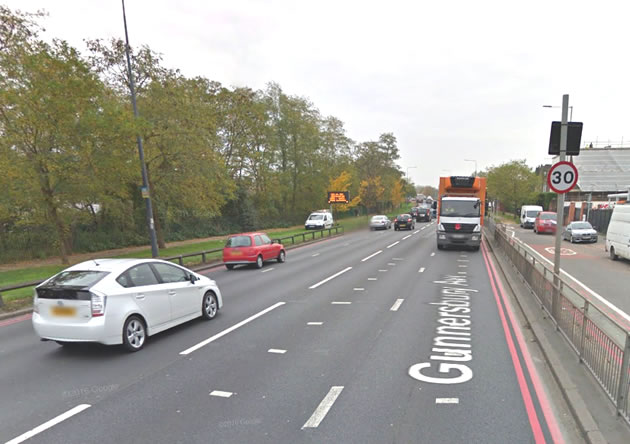
Gunnersbury Avenue north of Chiswick Roundabout. Picture: Google Street View
A local road has been identified as the nation’s most congested in a new global survey of traffic delays. The A406 northbound between Chiswick Roundabout and Hanger Lane in Ealing is estimated to have caused 73 hours of delays per driver last year.
Transportation analytics company INRIX has just published its all-new Traffic Scorecard. Based on a new methodology, the analysis has increased to 1,064 cities across 38 countries, making this the largest ever study of congestion.
Ironically the stretch of the North Circular on Gunnersbury Avenue which has been identified as causing the most delay to motorists was also recently highlighted as having the speed camera which was generating the highest amount in fines in London. It is likely that most of the delays caused on this road occur further north past the Uxbridge Road when in narrows to a single lane.
The study also found that London was the UK’s most congested city with the cost of congestion double the national average. London is the worst city for congestion in the UK across both peak and non-peak hours with drivers spending an average of 13% of their total drive time stuck in traffic.
Speeds fell by 80% (20 mph to 4.3 mph) in the centre of London during the day when congestion was at its worst, and by 83% (24 mph to 4 mph) in the evening during the worst periods.
The UK ranked as the 4th most congested developed country in the world and the 3rd most congested in Europe, with drivers spending an average of 32 hours a year in congestion during peak hours. For the first time, the INRIX Traffic Scorecard also includes the direct and indirect costs of congestion to all UK motorists, which amounted to £30.8 billion in 2016, an average of GBP968 per driver.
| INRIX 2016 Traffic Scorecard - UK's Top Ten Most Congested Roads in 2016 | ||
|---|---|---|
| City | Road | Total Hours of Delay |
| London | A406 Northbound Chiswick Roundabout Hanger Lane |
73 |
| London | A2 Eastbound New Cross Gate Prince Charles Rd | 62 |
| London | A3211 Eastbound Westminster Bridge London Bridge | 57 |
| London | A102 Northbound A2/Kidbrooke Blackwall Tunnel | 51 |
| London | A4200 Southbound Russell Square Aldwych | 50 |
| Belfast | A1 Southbound College Gardens Wallace Park | 49 |
| London | A308 Eastbound Putney Bridge Approach Sloane Square | 46 |
| Bristol | A431 Westbound Bryants Hill Lawrence Hill | 45 |
| Belfast | A24 Northbound Ormeau Road Ann Street | 45 |
| Manchester | A6 Northbound Macclesfield Road Heaton Lane | 44 |
In the UK, the 2016 Traffic Scorecard analysed congestion in 87 cities and large urban areas. London remains the UK's most congested city, and ranks 2nd in Europe after Moscow and 7th in the world. Drivers in London spent an average of 73 hours in gridlock during peak hours. This contributed to congestion costing London drivers £1,911 each and the capital as a whole £6.2 billion from direct and indirect costs. Direct costs relate to the value of fuel and time wasted, and indirect costs relate to freighting and business fees from company vehicles idling in traffic, which are passed on to household bills through higher prices.
"Despite Brexit, 2016 saw the UK economy remaining stable, fuel prices staying low and employment growing to an 11-year high, all of which incentivizes road travel and helped increase congestion as the 2016 Traffic Scorecard demonstrates," said Graham Cookson, Chief Economist, INRIX. "The cost of this congestion is staggering, stripping the economy of billions, impacting businesses and costing consumers dearly. To tackle this problem, we must consider bold options such as remote working, wider use of road user charging and investment in big data to create more effective and intelligent transportation systems."
| INRIX 2016 Traffic Scorecard - UK's 10 Most Congested Cities / Large Urban Areas | ||||
|---|---|---|---|---|
| City | Peak Hours Spent | Percentage of Total Drive Time | Total Cost Per Driver | Total Cost to the City |
| London | 73 |
12.7% |
£1,911 |
£6.2bn |
| Manchester | 39 |
9.9% |
£1,136 |
£233m |
| Aberdeen | 35 |
12.3% |
£1,331 |
£138m |
| Birmingham | 34 |
8.5% |
£990 |
£407m |
| Edinburgh | 31 |
9.8% |
£1,009 |
£225m |
| Guildford | 29 |
8.6% |
£812 |
£44m |
| Luton | 29 |
10.7% |
£964 |
£72m |
| Bournemouth | 27 |
10.8% |
£1,019 |
£84m |
| Hull | 27 |
9.4% |
£970 |
£109m |
| Bristol | 27 |
8.8% |
£845 |
£154m |
When getting in and out of London at peak hours, drivers achieved an average congested speed of 14.6 mph and spent 15% of their time in congestion.
At the global city level, Los Angeles tops the list of the world's most gridlock cities, with drivers spending on average 104 peak hours in congestion in 2016, followed by Moscow (91 hours), New York (89 hours), San Francisco (83 hours) and Bogota (80 hours). London ranked 7th out of the 1,064 cities analysed, after Sao Paulo at 6th where drivers spent 77 peak hours in congestion last year.
Of the 38 countries covered by the INRIX Traffic Scorecard, Thailand leads with the highest average hours spent in peak congestion (61 in 2016), outranking Columbia (47 hours) and Indonesia (47 hours) tying at 2nd, and Russia (42 hours) and the USA (42 hours) tying at 4th.
The UK was 11th in the global ranking, 4th amongst developed nations, and the 3rd most congested in Europe behind Russia and Turkey.
INRIX analysed 500 Terabytes of data from 300 million different sources covering over 5 million miles of road. The data used in the 2016 Traffic Scorecard is the congested or uncongested status of every segment of road for every minute of the day, as used by millions of drivers around the world that rely on INRIX-based traffic services.
February 20, 2017