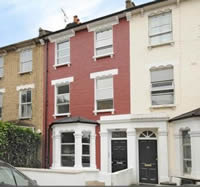
Hammersmith Property Prices Bounce Back in Spring
With the average semi-detached house now above two million pounds
Hammersmith prices are on the up again, after a slump in the chilly early months of 2013 - though the average is still well below the peak reached in summer last year when it was just short of £750,000.
The latest Land Registry figures show the total average was up a healthy 10.5% in the second quarter of the year, rising from £618,555 to £683,734.
The figures also show that it is the top end of the market which is performing most strongly. While the average price of flats slipped by a small 1.1% from £411,730 to £407,164, terraced houses jumped back over the million mark from £997,733 between January and March to an average of £1,104,730.
The best news for local agents however, is that after six months with no semi-detached houses recorded as sold, five changed hands in this quarter, with an average price of £2,033,000.
This compares with three semi-detached properties being sold with an average price of just £1,213,631 between July and September last year.
The statistics also contained one other piece of cheering news for Hammersmith's estate agents. While the winter weather kept buyers indoors in the first quarter, with just 68 sales being recorded, it bounced back in spring, almost doubling to 119.
 The June data from Land Registry's
House Price Index shows that London
saw a sharp rise in prices during the
month up by 3.1% compared with May.
It remains the best performing property market in England and Wales rising by 6.9% over the last year to £383,930.
For the country as a whole prices only rose by 0.8% over the year which takes the average property value in England and Wales to £162,621.
The most up-to-date figures available show that during April 013, the number of completed house sales in England and Wales increased by 12 per cent to 48,367 compared with 43,252 in April 2012.
The number of properties sold in England and Wales for over £1 million in April 2013 increased by 45 per cent to 703 from 484 in April 2012.
The West Midlands was the only region to see an increase (8 per cent) in repossession sales between April 2012 and April 2013. The region with the greatest fall in the number of repossession sales was London where repossessions dropped by 37 per cent (April 2013 compared with April 2012).
A detail listing of properties sold recently in the area will be appearing in a forthcoming edition of the Hammersmith newsletter.
| Hammersmith Property Prices (April - June 2013) | ||||||||||
|---|---|---|---|---|---|---|---|---|---|---|
| Area | Detached | Sales | Semi-Det | Sales | Terraced | Sales | Flat/Mais | Sales | Total Averages | Total Sales |
| W6 0 | 0 | 0 | 2,372,500 | 4 | 1,224,545 | 11 | 446,990 | 31 | 800,363 | 46 |
| W6 7 | 0 | 0 | 0 | 0 | 1,475,714 | 7 | 411,321 | 14 | 766,119 | 21 |
| W6 8 | 775,000 | 1 | 0 | 0 | 889,369 | 11 | 355,903 | 18 | 565,477 | 30 |
| W6 9 | 0 | 0 | 675,000 | 1 | 847,083 | 6 | 382,493 | 15 | 522,495 | 22 |
| Total | 775,000 | 1 | 2,033,000 | 5 | 1,104,730 | 35 | 407,164 | 78 | 683,734 | 119 |
| Last quarter | - | - | - | - | 10.7% | 45.8% | -1.1% | 77.3% | 10.5% | 75.0% |
| Last year | - | - | - | - | 10.3% | -12.5% | 10.5% | 39.3% | 8.1% | 24.0% |
| Last three years | - | - | 103.2% | 66.7% | 29.4% | -12.5% | 17.7% | 16.4% | 24.7% | 8.2% |
| Last five years | - | - | 93.4% | 25.0% | 61.3% | 66.7% | 12.9% | 50.0% | 41.0% | 54.5% |
| Last ten years | - | - | 178.0% | 0.0% | 128.1% | -20.5% | 52.5% | -1.3% | 90.0% | -7.0% |
| Hammersmith Property Prices (January - March 2013) | ||||||
|---|---|---|---|---|---|---|
| Area | Terraced | Sales | Flat/Mais | Sales | Total Averages | Total Sales |
| W6 0 | 1156409 | 11 | 427853 | 16 | 724672 | 27 |
| W6 7 | 0 | 0 | 437863 | 11 | 437863 | 11 |
| W6 8 | 763166 | 6 | 392070 | 14 | 503399 | 20 |
| W6 9 | 949442 | 7 | 321666 | 3 | 761109 | 10 |
| Total | 997733 | 24 | 411730 | 44 | 618555 | 68 |
| Last quarter | -7.1% | -27.3% | -0.8% | -22.8% | -5.8% | -24.4% |
| Last year | -5.3% | 0.0% | 18.1% | -27.9% | 10.6% | -22.7% |
| Last three years | 11.6% | -45.5% | 23.8% | -6.4% | 2.4% | -25.3% |
| Last five years | 14.2% | -11.1% | 5.3% | -29.0% | 15.1% | -23.6% |
| Last ten years | 121.3% | -52.9% | 70.1% | -45.7% | 91.7% | -48.5% |
Source: Land Registry
August 23, 2013
Related links
|
 2
2