Hammersmith Property Prices Tumble
Turnover down as home values retreat from record levels
Hammersmith property prices have failed to maintain the momentum achieved in the Spring and Summer of last year according to the latest official figures.
 The average price of a home in the W6 post code area changing hands in the fourth quarter of 2012 was £656,906, say Land Registry figures.
This is down by 11.8% compared with the previous three months.
However, prices are still up by a third compared with the same period in the previous year and have more than doubled over the last decade.
Perhaps more worrying for local estate agents than the slip back in prices is the lack of transactions in the local area.
Only 90 home sales have been reported to the Land Registry so far for the final three months of 2012. This is down by 35% compared with the same period in 2011.
While the number of sales was down for both terraced houses, from 43 in the previous quarter to 33 and flats, down from 68 to 57, this slowdown was most noticeable at the top end of the market.
Whereas three semi-detached houses changed hands between July and September fetching an average price of £1,213,631 none were sold in the final quarter.
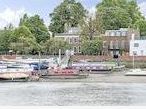
Agents will be hoping this changes in 2013, with 13 properties currently available in W6 with a price tag of £1 million or more, including one of Hammersmith's most distinctive homes, the former St Paul's Vicarage in Lower Mall, an 18th century Grade II listed riverside house with eight bedrooms,five reception rooms, a separate staff flat, a garden, balconies and planning permission for a roof terrace, being sold by local agents Strutt and Parker for £5,500,000.
London was the best performing part of England and Wales during 2012 with an increase of 8.4% The average price of a home in London is now £371,223 according to the Land Registry.
For England and Wales as a whole prices rose by 1.7% over the year to £162,080.
The most up-to-date figures available show that during October 2012, the number of completed house sales in England and Wales decreased by 3 per cent to 56,337 compared with 57,988 in October 2011.
The number of properties sold in England and Wales for over £1 million in October 2012 increased by 14 per cent to 623 from 548 in October 2011.
All regions saw a decrease in repossessions between October 2011 and October 2012 ranging from 8 per cent in the South East to 35 per cent in the North East.
A detail listing of properties sold recently in the area will be appearing in a forthcoming edition of the Hammersmith newsletter.
| Hammersmith Property Prices - October to December 2012 | ||||||
|---|---|---|---|---|---|---|
| Area | Terraced | Sales | Flat/Mais | Sales | Total Averages |
Total Sales |
| W6 0 | 1166562 | 16 | 426020 | 25 | 715012 | 41 |
| W6 7 | 1530000 | 5 | 485400 | 10 | 833600 | 15 |
| W6 8 | 751014 | 8 | 369690 | 10 | 539167 | 18 |
| W6 9 | 782500 | 4 | 372250 | 12 | 474813 | 16 |
| Total | 1074336 | 33 | 415235 | 57 | 656906 | 90 |
| Last quarter | -14.6% | -23.3% | 3.9% | -16.2% | -11.8% | -21.1% |
| Last year | 52.5% | -17.5% | 10.7% | -39.4% | 33.0% | -35.3% |
| Last three years | 25.9% | 17.9% | 34.4% | 3.6% | 33.3% | 8.4% |
| Last five years | 29.0% | -8.3% | 21.6% | -44.1% | 34.5% | -36.2% |
| Last ten years | 120.4% | -40.0% | 74.1% | -52.5% | 107.4% | -48.6% |
| Hammersmith Property Prices - July - September 2012 | ||||||||
|---|---|---|---|---|---|---|---|---|
| Area | Semi-Det | Sales | Terraced | Sales | Flat/ Mais |
Sales | Total Averages | Total Sales |
| W6 0 | 1213631 | 3 | 1144533 | 18 | 429687 | 24 | 767888 | 45 |
| W6 7 | 0 | 0 | 1767727 | 11 | 419435 | 20 | 897861 | 31 |
| W6 8 | 0 | 0 | 793855 | 9 | 346329 | 12 | 538126 | 21 |
| W6 9 | 0 | 0 | 1376699 | 5 | 360583 | 12 | 659441 | 17 |
| Total | 1213631 | 3 | 1257553 | 43 | 399767 | 68 | 744735 | 114 |
| Last quarter | - | - | 25.5% | 7.5% | 8.5% | 21.4% | 17.8% | 18.8% |
| Last year | -12.4% | -57.1% | 45.4% | -12.2% | 15.5% | -10.5% | 25.4% | -13.6% |
| Last three years | - | - | 55.7% | 2.4% | 31.6% | 15.3% | 45.1% | 12.9% |
| Last five years | -14.0% | -25.0% | 56.9% | -29.5% | 15.9% | -28.4% | 36.5% | -28.8% |
| Last ten years | 100.3% | -40.0% | 159.3% | -46.3% | 58.6% | -51.1% | 117.1% | -49.1% |
Source: Land Registry
February 16, 2013
Related links
|
