Hammersmith House Prices Slide from All Time High
Average value in W6 down over 15% on previous quarter
The average property price in Hammersmith slid by a dramatic 15.5% in the first three months of 2011, down from an all time high figure of £631,677 in the previous quarter to £533,938.
These latest figures from the Land Registry seem to show after steady price rises throughout 2010, the local property market has gone into reverse.
The figures show that prices were down at all levels of the property market, with terraced houses hit hardest plunging by 18.8% from £1,007,378 between October and December to £818,141.
Semi-detached houses also slipped, though the average price remained above the million mark at £1, 037,333.
At the lower end of the market, the average price of a flat or maisonette dropped by 8.8%, from £364, 253 to £332, 293. This could be good news for first timers, according to local agent Winkworth, are now back hunting for affordable homes.
Winkworth's latest market report says: " Last year, the first time buyer market took a hit and there was a marked fall in demand during the second half of the year.
"First time buyers have started to come back this year. They're heavily supported by the Bank of Mum and Dad, and a good first time property will always sell."
Across the capital however, the picture is different. London is now the only area in the country where prices have risen compared with the same period last year. The Land Registry's House Price Index shows that the average price in the capital was £336,828 in March 2011 up by 0.8% compared to the same month last year.
For England and Wales the average price is now £160,996 down by 2.3% from March 2010. Prices in the north east have fallen by 9.3% and in Wales they are down by 7.2%.
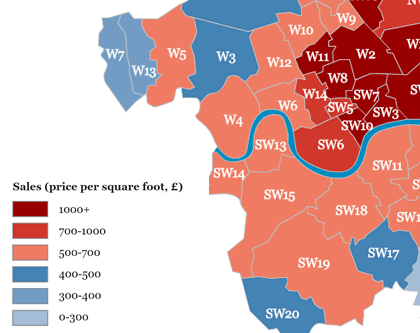
Sales Price Map for West and South West London

Source: Jones Lang LaSalle/Financial Times
Meanwhile, a new report states that the price per square foot of property in Hammersmith is £622, with an annual rental of £25.97 psf giving a yield of 4.18%.
This puts it in the middle of prices within the borough, with Shepherd's Bush's price per square foot sitting at £539 and Fulhams' reaching £702 - the highest price in West London.
In Hammersmith, says the report, yields have fallen as capital values have moved up more quickly than rents with analysts saying this is due to the area moving to full 'gentrification'.
| Area | Sale Price per sq ft | Rental Price per sq ft | Yield |
|---|---|---|---|
| Fulham | 702 |
32.87 |
4.68 |
| Chiswick | 599 |
30.07 |
5.02 |
| Acton | 440 |
23.40 |
4.02 |
| Ealing (W5) | 503 |
20.74 |
4.10 |
| Ealing (W13) | 393 |
22.42 |
5.48 |
| Hammersmith | 622 |
25.97 |
4.18 |
| Shepherd's Bush | 539 |
n/a |
n/a |
| Putney | 565 |
21.70 |
n/a |
| Barnes | 570 |
n/a |
n/a |
| Wandsworth | 560 |
31.46 |
5.62 |
Source: Jones Lang LaSalle/Financial Times
Hammersmith Property Prices - January - March 2011
| Area | Semi-Det | Sales | Terraced | Sales | Flat/Mais | Sales | Total Averages | Total Sales |
|---|---|---|---|---|---|---|---|---|
| W6 0 | 1037333 | 3 | 842675 | 12 | 316082 | 18 | 573139 | 33 |
| W6 7 | 0 | 0 | 1441250 | 4 | 329172 | 11 | 625726 | 15 |
| W6 8 | 0 | 0 | 614838 | 9 | 347857 | 14 | 452328 | 23 |
| W6 9 | 0 | 0 | 698500 | 8 | 342131 | 11 | 492181 | 19 |
| Total | 1037333 | 3 | 818141 | 33 | 332293 | 54 | 533938 | 90 |
| Last quarter | - | - | -18.8% | -15.4% | -8.8% | -12.9% | -15.5% | -13.5% |
| Last year | - | - | -8.5% | -25.0% | -0.1% | 14.9% | -11.6% | -1.1% |
| Last three years | - | - | -6.3% | 22.2% | -15.0% | -12.9% | -0.7% | 1.1% |
Hammersmith Property Prices - October - December 2010
| Area | Semi-Det | Sales | Terraced | Sales | Flat/Mais | Sales | Total Averages | Total Sales |
|---|---|---|---|---|---|---|---|---|
| W6 0 | 1274333 | 3 | 961015 | 16 | 359438 | 13 | 745998 | 32 |
| W6 7 | 0 | 0 | 1567000 | 5 | 411531 | 16 | 686643 | 21 |
| W6 8 | 0 | 0 | 650150 | 10 | 358692 | 13 | 485413 | 23 |
| W6 9 | 0 | 0 | 1196875 | 8 | 333175 | 20 | 579946 | 28 |
| Total | 1274333 | 3 | 1007378 | 39 | 364253 | 62 | 631677 | 104 |
| Last quarter | - | - | 16.2% | -20.4% | -4.4% | -19.5% | 6.0% | -20.6% |
| Last year | - | - | 18.0% | 39.3% | 17.9% | 12.7% | 28.2% | 25.3% |
| Last three years | - | - | 20.9% | 8.3% | 6.6% | -39.2% | 29.3% | -26.2% |
Source: Land Registry
May 27, 2011
Related links
|
