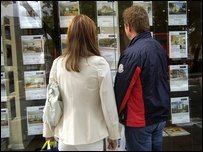
Hammersmith Home Market Grinds to a Standstill
Property sales in the local area hit an all-time low
Local estate agents are facing the toughest times ever seen in their industry's history with the number of home sales in the area falling to levels that are unprecedented.
Only 34 properties have been recorded as having been sold so far this year, well below even the paltry turnover seen at the end of 2008.
Closures of the local offices of estate agents seem to be inevitable at this stage. Given the number, there are likely to be some that have gone months without getting commission on a single transaction.
Agents may take some crumb of comfort from the headline number that shows that the average price of property in Hammersmith is falling more slowly that the rest of London. In the latest quarter property prices appear to have actually started rising again - up by 13.3% since the end of the year. On an annual basis the average property appears to be down by only 4.4% but a closer look at the figures shows terraced house prices down by 18.3% and flat prices down by 26.1% The overall average is falling less slowly because house prices are making up a larger proportion of transactions.
The average property in the W6 post code area currently costs £513,838.
Derek Fletcher of Edward D’arc told us, “The shortage in supply (due primarily to lack of confidence in the market generally, and compounded by fears of unemployment) appears to have had the effect of stemming the fall in property prices, particularly at the higher end of the market. Whilst there is a feeling that the housing market may have bottomed out, demand from buyers remains weak and therefore prices are unlikely to see an upturn in the near future, but the medium to long term view looks a lot healthier than it did three or four months ago.”
The Land Registry data for March for the country as a whole shows an annual house price change of -16.2% which brings price levels back to those seen in August 2004.
London prices have fallen by 15.4 per cent to £299,613 however, prices did rise slightly in March, the first time in a year the price index has seen a positive change.
The numbers below are subject to revision as is it usual that some properties are added late to the Land Registry's database.
Hammersmith Property Prices - January - March 2009
| Area | Terraced | Sales | Flat/Mais | Sales | Total Ave | Total Sales |
| W6 0 | 597642 | 7 | 321583 | 6 | 470230 | 13 |
| W6 7 | 809333 | 3 | 186666 | 3 | 498000 | 6 |
| W6 8 | 494250 | 4 | 0 | 0 | 494250 | 4 |
| W6 9 | 1065000 | 4 | 304642 | 7 | 581136 | 11 |
| Total | 713805 | 18 | 288874 | 16 | 513838 | 34 |
| Last quarter | 5.7% | -28.0% | -1.4% | -54.3% | 13.6% | -43.3% |
| Last year | -18.3% | -33.3% | -26.1% | -74.2% | -4.4% | -61.8% |
| Last five years | 33.7% | -57.1% | 9.6% | -85.3% | 50.6% | -77.9% |
Source: Land Registry
October 5, 2010
Related links
|
