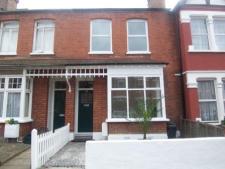
Detached House Sales Inflate Prices in W5
Property values in the W5 and W13 areas
Latest property information from the Land Registry shows a mixed bag for the W5 and W13 areas.
Prices are up in the last quarter in W5 by 16.2% but this is a bit misleading as there have been more sales of larger houses than in the previous quarter - nine detached houses sold at an average price of over £1.2 million.
There has been a much lower number of flats sold in the area. Indeed on a like for like basis in W5 flats and terrace house sales are actually down compared with last quarter.
In W13 volumes are very low - down by 30% compared with last year and prices down by 7%.
The June data from Land Registry's flagship House Price Index shows an annual price decrease of -2.5 per cent which takes the average property value in England and Wales to £161,479.
The monthly change from May to June is 0.0 per cent.
London is the only region in England and Wales to have experienced an increase in its average property value over the last 12 months with a movement of 0.8%. Over the same period property prices in the North East were down by 7.1%. This brings the average price in London to £339,480 compare to £161,479 in England and Wales as a whole.
In a forthcoming edition of the Ealingtoday.co,uk newsletter there will be a complete listing of recent property sales in the area.
To register to receive it click here.
Ealing Property Prices - April - June 2011
W5 Post Code Area
| Area | Detached | Sales | Semi-Det | Sales | Terrace | Sales | Flat/ Mais |
Sales | Total Ave. | Total Sales |
|---|---|---|---|---|---|---|---|---|---|---|
| W5 1 | 0 | 0 | 748000 | 5 | 490045 | 10 | 255060 | 10 | 447642 | 25 |
| W5 2 | 1311000 | 3 | 0 | 0 | 0 | 0 | 363037 | 12 | 552630 | 15 |
| W5 3 | 1401666 | 3 | 740000 | 4 | 0 | 0 | 284404 | 16 | 509368 | 23 |
| W5 4 | 0 | 0 | 0 | 0 | 451519 | 13 | 262844 | 10 | 369486 | 23 |
| W5 5 | 943333 | 3 | 885500 | 4 | 504375 | 4 | 365243 | 8 | 595339 | 19 |
| Total | 1218666 | 9 | 787846 | 13 | 473618 | 27 | 303712 | 56 | 485767 | 105 |
| Change in Quarter | - | - | 13.7% | 62.5% | -2.0% | 12.5% | -3.8% | -28.2% | 28.0% | -4.5% |
| Change in year | 9.1% | 12.5% | 32.3% | -27.8% | 4.1% | -6.9% | 10.2% | -18.8% | 16.2% | -15.3% |
| Change in three years | - | - | 12.1% | 44.4% | -3.9% | -12.9% | 6.7% | -5.1% | 25.2% | 6.1% |
W13 Post Code Area
| Area | Semi-Det | Sales | Terraced | Sales | Flat/ Mais |
Sales | Total Averages | Total Sales |
|---|---|---|---|---|---|---|---|---|
| W13 0 | 533333 | 3 | 323700 | 5 | 210490 | 5 | 328535 | 13 |
| W13 8 | 550250 | 4 | 561875 | 4 | 225097 | 10 | 372193 | 18 |
| W13 9 | 0 | 0 | 469629 | 24 | 251868 | 8 | 415189 | 32 |
| Total | 543000 | 7 | 458700 | 33 | 231233 | 23 | 385023 | 63 |
| Change in Quarter | -27.7% | 16.7% | 0.5% | 13.8% | -4.0% | -48.9% | 7.7% | -21.3% |
| Change in Year | -9.7% | -68.2% | 0.6% | -2.9% | -8.4% | -32.4% | -7.1% | -30.0% |
| Change in Three Years | 1.6% | -63.2% | 8.1% | 13.8% | -10.2% | -43.9% | 3.8% | -29.2% |
Data in this report is subject to crown copyright protection.
August 22 2011
Related links
|
