Nunn...the Wiser
Chiswick – Sales Market Update Q3 2023 (Ad)

Sales Review Q3 2023
By Mateo Asminian — Sales, Andrew Nunn & Associates
The summer: an opportunity to catch up on some much-needed R&R… especially true in the world of buying and selling property.
Q3 typically sees a notable drop off in activity in the property market nationwide. Chiswick is no different, with local homeowners swapping riverside for seaside while schools are shut and the weather is warm. In 2021 and 2022, we noted busier-than-usual summers, with more favourable mortgage rates and the release of the COVID-19 pent up supply and demand leading many to prioritise their next move. This summer, with a gloomier economic outlook and little incentive for homeowners/home seekers to transact, we very much saw a return to ‘normality’.
¨ Total instructions down 18%
¨ Total sales down 11%
¨ 2 in 5 need price reduction to sell
¨ House values cool by £13/sqft (1.5%)
Instructions
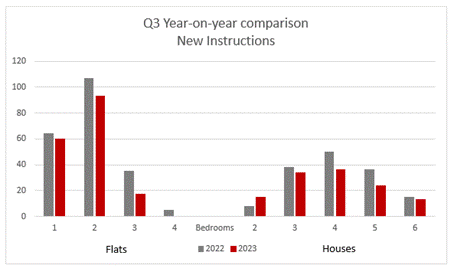
Once again, we’ve noted a drop in supply levels when comparing year on year. Last year, buyers would have had 358 properties to choose from across the board in Q3, a figure that has fallen to 292 a year later.
Of the two property types, flats saw the biggest drop in stock levels, falling by just under a fifth on their Q3 2022 levels. Inflated mortgage rates and the reintegration of the commute are two key reasons here, as young professionals persist with city living while the pandemic trend of swapping compact London property for space outside the M25 continues to fade. The change in stock levels for houses was not far off that of flats, with house buyers having 17% less options to choose from in the summer months than those looking within the same period last year. This year’s numbers are more in line with the volume of instructions seen in the 3 years leading up to the pandemic, after which market trends became distorted. Our data showed a spike in 2-bedroom houses coming onto the market – the reason for this is unclear, but it is worth noting that a fifth of these sold for less than the average flat in Q3.
Sales Agreed
Last quarter, we noted very little change in the volume of sales agreed for houses and a significant change among flats when comparing to the same quarter in 2022. In Q3, flat sales saw a slight cooling of 5.3% year-on-year, with their values only marginally regressing by 0.5% to an average £784/sqft. This time, it was houses that saw more change with a fall of 15% on the 92 sales in Q3 2022 and their average values cooling some 1.5% year-on-year to an average of £859/sqft. What’s more, 28 of the 71 flats (39.4%) and 31 of the 78 houses (39.7%) that sold in Q3 relied on price reductions to help achieve a sale—these are the highest quarterly reduction rates we have recorded this year.
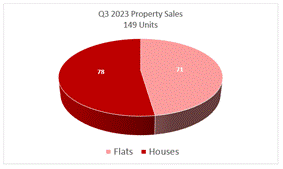
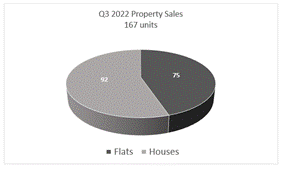
Naturally, the seasonality in the market means that house hunters – predominantly families in W4’s case – are more inclined to agree a sale in the spring or autumn, with a view to transacting/moving in during the key school holidays. Last year, with the race against rising interest rates at the top of the list of importance for most, families that missed out in the Spring were forced to continue their searches in the summer months. This year, these buyers chose to put their searches on hold instead. We have also noted more movers opting to rent instead of buy, and this is becoming especially evident among those whose moves are dependent on a sale.
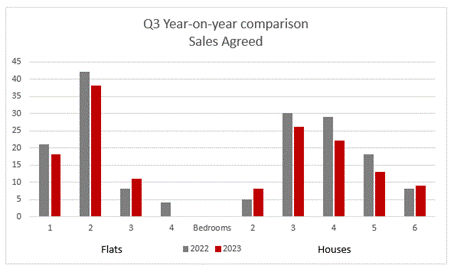
Conversely, flats (typically households of one or two adults) are steadier throughout the year and less tied to the scholar calendar, and hence their market trends demonstrate less volatility between seasons. In their case, there will be less variation year-on-year as, unlike houses, there was no significant spike in demand last year.
Cause for concern?
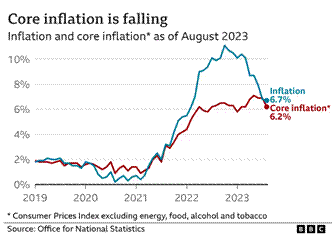
There is no escaping that the market sentiment has cooled—this is a fact, and it is this up-and-down dynamic that allows opportunity for everybody involved in property. W4’s omnipresent safety blanket means these lulls often have less of an impact on capital values and transactional levels than in the wider market. Of course, Q3 is generally one of the more quiet periods in the year in west London, so the data we have collated and analysed is as anticipated.
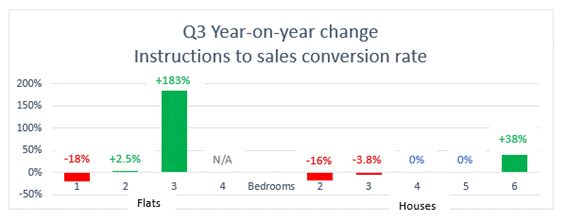
The table below demonstrates that only 1-bedroom flats and 2-bedroom houses were notably less likely to sell in Q3 this year than the same quarter in 2022. Otherwise, conversion rates remain either almost the same, the exact same or notably improved! Furthermore, we are likely to have already seen the bulk of the rises in interest rates and inflation and, hence, our message is: “keep calm and carry on”.
![]()
Mortgage Review Q2 2023
By James Muncaster — Director, Chagnon Financial
As the summer draws to a close and autumn comes into view, there has been a much more positive outlook to the mortgage market. In September, both the, better than expected, inflation news and Base Rate decision from the Bank of England has given some impetus to falling fixed rate mortgages.
The hold in base rate has also meant that tracker and variable rates stay still.
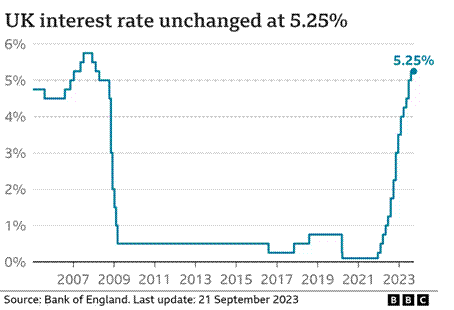
As of the end of September, 5yr fixed rates are now under 5% and 2yr fixed rates are heading close to 5.25%
The big question is how long this will last for and is this a time to wait? With the mortgage market being the most volatile I can remember since the Financial Crisis, waiting may not be the best thing to do. With the property market more balanced between seller and buyer, waiting for the mortgage market may mean missing out! There is no guarantee that this 'stability' stays and there only needs to be another round of worse economic data and the rates start to increase again!
From a retail bank perspective, it has been encouraging to see some innovation in policy. Increasing the age to lend to, revamp of Interest Only, improvements in affordability are areas that banks have made recent changes. The retail banks recognise the challenges that buyers have with mortgages now and are trying to help manage this within their regulatory framework.
I am optimistic that 2023 will finish the year well and look forward to a much more stable 2024.
![]()
Lettings Review Q2 2023
By Katherine McDowall — Lettings, Andrew Nunn & Associates
In summary, it appears the significant supply and demand imbalance we have seen in the market over the last few years has started to change in Q3. There seems to have been an opposing shift in both supply and demand over this period when compared to both Q2 and 2022.
Instructions
The number of new W4 instructions in Q3 (578) is up 18% on the Q2 number (489) with flats up 7.7% and houses up a considerable 66%. The noticeable increase in the supply of houses is fuelled by the annual seasonal (summer) availability of houses driven by tenants vacating and buying due to an onerous increase in rent at review stage or simply the end of their 2- or 3-year corporate tenancy.
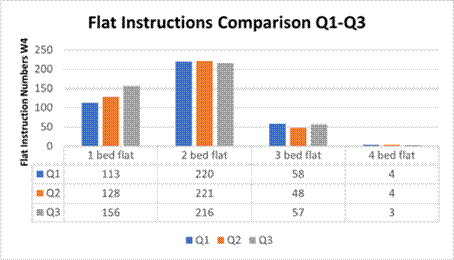
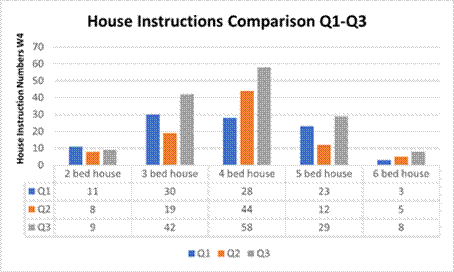
House instructions made up 25% of the total market and of the 146 house instructions, 5-bedroom houses were up 142%, closely followed by 3-bedroom houses up 121% and 6-bedroom houses with a 60% increase. This seasonal uplift has been more dramatic in 2023 than in previous years as greater fluidity returns to the rental market with companies moving employees around the globe again and private individuals work habits moving back toward being office based. Flat instructions were a little more volatile Q3 on Q2 with 1-bedroom flats up 22% and 3-bedroom flats up 19% compared to 2-bedroom flats, which fell by 2%.
Demand
Previous 2022 newsletters reported that properties were letting within the first few days of coming onto market; this urgency among tenants cooled slightly in Q2 of this year and this trend continued into Q3. We recorded an average period of 11.9 days for flats and 16.1 days for houses from the day of launch to securing a tenant. What is a little surprising is the volume of enquiries is down by some 19.5% Q3 to Q2 and 15.6% down when compared to the same period last year so we will need wait to see if this is a blip or whether the continual rise in rental values is starting to impact on demand.
Values
Rents are continuing to rise with 1- and 2-bedroom flats showing a quarterly improvement of 4% and 8% respectively whilst 3-, 4- and 5-bedroom homes rose by 13%, 12% and 4%. All other property types saw values fall marginally however those property types make up a small proportion of the overall market. The average 1 bedroom flat now achieves £1828pcm in comparison to £1408pcm in 2019, and the larger 5-bedroom family home can now command £7800pcm, an increase of £2050pcm in the last four years!
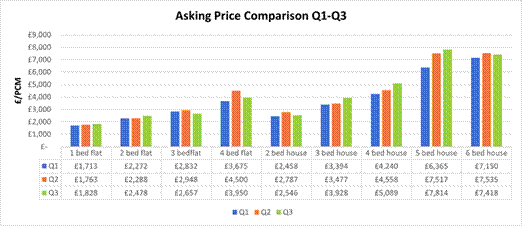
With rents having increased more than the average household’s income has risen, logic would suggest that there will be fewer applicants looking to rent and the period of time to find a tenant would therefore increase. We have reported that demand has fallen in Q3; however, 73% of lets agreed during that period have been achieved inside 14 days of the property coming onto the open market. 20% of properties required a price reduction in order to secure a tenant compared to 25% of properties in Q2. As we know, values have been increasing astronomically and it could be viewed that some agents/landlords are testing the waters with their initial pricing, which is not surprising.
Against the backdrop of increasing supply and falling demand it is interesting to see that the majority of properties coming to market are still being let within 14 days, which demonstrates how great the imbalance between supply and demand has become over the last few years and suggests further increases will be seen in rental values going forward.
* * * * * * * * * Lettings Review Q2 2023
By Katherine McDowall — Lettings, Andrew Nunn & Associates
Unsurprisingly, given the continued supply and demand imbalance, the market remained robust in Q2, albeit with a more considered audience, and rents continued to rise.
Instructions
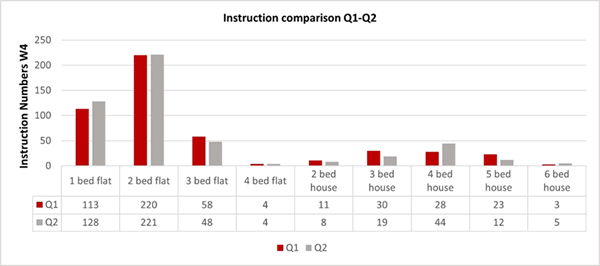
The number of new W4 instructions in Q2 (489) was almost identical to that of Q1 (490). Naturally, flats dominated the instructions this spring, with just 18% (88) of new properties coming onto the market providing an option for those in search of a house.
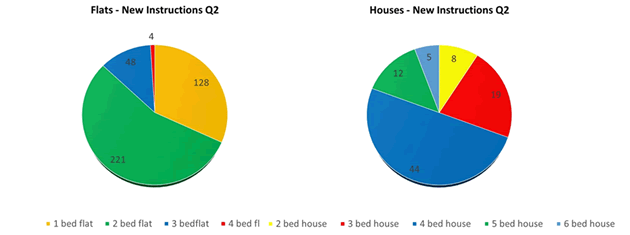
Of the 401 flat instructions, 1-bedroom flats were ‘most improved’ when comparing to last quarter – an increase of 13.2%. As for the 88 houses that came onto the market, 4 and 6-bedroom houses saw an increase in market share of 57.1% and 66.6% respectively. 3-bedroom house instructions, however, dropped some 36.6%. Of course, the market is seasonal and we would expect these family homes to come up in the Spring/Summer months, which is reflected in these figures.
We have noticed some ‘accidental landlords’ entering the market since the start of the year, although this ‘top up’ of supply remains some way off the levels needed to fulfil the demand. Hence, tenants are likely to continue facing frustration when searching and budgeting for their move.
Demand
Last year, we reported that properties were letting within the first few days of coming onto market; this urgency among tenants has cooled slightly and in Q2 of this year, we recorded an average period of 13.3 days for flats and 10.9 days for houses from the day of launch to securing a tenant. That said, the volume of enquiries is only marginally down – 1.9% and 2.7% respectively – when comparing to the same period in 2022, and our number of lets in Q2 is coincidentally unchanged year-on-year. With the increase in stock in the flat market, tenants are approaching viewings with less pressure to offer, whereas it is clear that the low volumes of houses coming available has led to faster lets as the demand for these remains unaltered.
Values
Rents are continuing to rise and our records are showing they have risen on average by a further 5-10% on last year, bringing the increase on the pre-pandemic averages to 25-30% (or more!). The average one-bedroom flat now achieves £1763pcm in comparison to £1408pcm in 2019, and the larger family homes can now command £7500pcm, an increase of £1750pcm in the last four years.
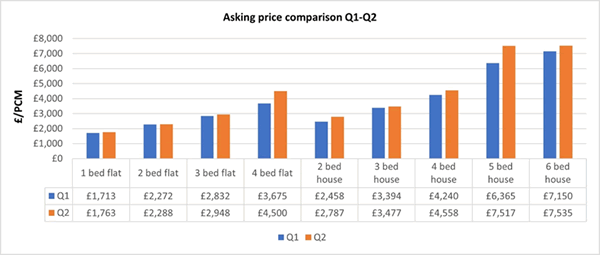
With rents having increased more than the average household’s income has risen, tenants are having to either sacrifice the size, style or location of their next property. Furthermore, tenants are now 69% more likely to renew their existing tenancy, in most cases for increased rents.
In such a strong market, it can seem appropriate to ‘push the parameters’ on price; but, as the data shows, with 22% of flats and 25% of houses having needed a price reduction to secure a let in Q2, this can slow the marketing process and potentially lead to a void period. This is a stark contrast to the last year where reductions were few and far between. At Andrew Nunn & Associates, we pride ourselves on our knowledge of the market and value our properties accordingly, reflected in the fact that only 8% of our lets agreed in Q2 required a price reduction to achieve an agreement in Q2.
* * * * * * * * *
Advertorial
October 6, 2023
Related links
|
