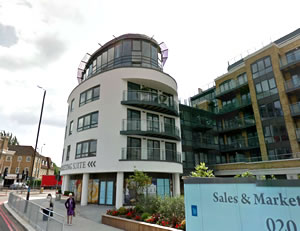
Luxury Flat Sales Fuel TW8 Property Price Surge
Average home value in Brentford rises to new record level
The average price of a home in Brentford has risen above £400,000 for the first time with a renewed spate of sales in the Kew Bridge development driving up prices.
According to the Land Registry, the average price of a home in Brentford during the first three months of 2013 was £431,296.
79 properties were reported as changing hands during the quarter 59 of which were flats and of these 22 were in the upscale 8, Kew Bridge Road development. One of these cost its new owner £992,500 to become the fifth most expensive property sale in Brentford. Developer St. George's is reportedly struggling to sell the penthouse apartment in the development which was originally valued at £3 million but has since been reduced in price. Even at the lower price it would be more than double the cost of the existing highest price property sale in Brentford.
Top Twenty Brentford Property Sales
Simon Groves of Quilliam Property Services says, "Brentford is slowly taking on a special feel that people from other areas are coming in to see and experience. This can be seen in highly successful Sunday market. Local residents took the trouble to decorate market place with 'Yarn Bombing' which brightened up Market Place no end!”
He reports strong demand for two bedroom properties particularly in the Brentford Dock development.
Ray Upcraft, partner at Russell Collins estate agents says, "Brentford has undoubtedly grown in stature in recent years. One of the reasons being its position in between Chiswick, Kew, Ealing etc and many of those resident in West London's premier locations have targeted Brentford as it has remained largely undiscovered (until now!)."
He adds that it is not just the riverside developments and the Butts which are attracting buyers. Other favourites include Grosvenor, Lateward, Hamilton & Clifden roads where his agency has sold many houses lately.
The riverside apartments are also very popular. The ones with the best views command the highest prices, naturally.''
The March data from Land Registry's House Price Index shows that London remains the best performing property market in England and Wales. The average price of a home in the capital rose by 9.6% over the year to £374,568.
For the country as a whole prices only rose by 0.% which takes the average property value in England and Wales to £161,793. London has seen a rise in repossessions which were up by 28% in January 2013 compared with the same month in 2012.
A list of properties sold in the Brentford area will appear in a forthcoming edition of the BrentfordTW8.com newsletter.
| Brentford Property Prices - (January - March 2013) | ||||||||
|---|---|---|---|---|---|---|---|---|
| Area | Semi-Det | Sales | Terraced | Sales | Flat/Mais | Sales | Total Averages | Total Sales |
| TW8 0 | 0 | 0 | 369700 | 10 | 513929 | 42 | 486193 | 52 |
| TW8 8 | 0 | 0 | 0 | 0 | 298995 | 12 | 298995 | 12 |
| TW8 9 | 387625 | 4 | 433825 | 6 | 209800 | 5 | 346830 | 15 |
| Total | 387625 | 4 | 393747 | 16 | 444440 | 59 | 431296 | 79 |
| Change in Quarter | 8.7% | 33.3% | 8.5% | 0.0% | 58.7% | 84.4% | 38.8% | 54.9% |
| Change in year | - | - | 23.1% | 128.6% | 64.8% | 59.5% | 55.3% | 79.5% |
| Change in 3 years | - | - | 29.4% | 100.0% | 70.3% | 210.5% | 57.5% | 192.6% |
| Change in 5 years | -8.6% | -20.0% | 20.4% | 77.8% | 42.8% | 110.7% | 31.5% | 88.1% |
| Change in 10 years | - | - | 69.0% | 100.0% | 68.6% | 7.3% | 66.0% | 25.4% |
| Brentford Property Prices - (October to December 2012) | ||||||||
|---|---|---|---|---|---|---|---|---|
| Area | Semi-Det | Sales | Terraced | Sales | Flat/Mais | Sales | Total Averages | Total Sales |
| TW8 0 | 0 | 0 | 351064 | 7 | 312768 | 11 | 327661 | 18 |
| TW8 8 | 356666 | 3 | 0 | 0 | 267666 | 18 | 280380 | 21 |
| TW8 9 | 0 | 0 | 372333 | 9 | 235166 | 3 | 338041 | 12 |
| Total | 356666 | 3 | 363028 | 16 | 280123 | 32 | 310635 | 51 |
| Change in Quarter | -29.1% | 0.0% | -12.8% | 23.1% | -13.7% | -46.7% | -10.6% | -32.9% |
| Change in year | 8.1% | -57.1% | -1.7% | 60.0% | 3.5% | -17.9% | 5.1% | -8.9% |
| Change in 3 years | - | - | 1.7% | 6.7% | 15.8% | -13.5% | 12.9% | -1.9% |
| Change in 5 years | 3.9% | -72.7% | 6.4% | -23.8% | -6.0% | -15.8% | -2.3% | -27.1% |
| Change in 10 years | 39.9% | -40.0% | 38.0% | 14.3% | 14.8% | -75.9% | 26.2% | -66.4% |
Where do I live? Brentford TW8 postcodes are divided into three sectors, TW8 0xx, TW8 8xx and TW8 9xx. Broadly speaking, TW8 0xx covers areas east of Boston Manor Road, TW8 8xx goes west of Boston Manor Road, whilst TW8 9xx covers the areas to the north of the A4.
Source: Land Registry
May 17, 2013
